THE PLACENTAL BARRIER

The placenta forms a barrier to the transfer of drugs between the mother and the fetus, but increasing lipid-solubility, decreasing maternal protein binding, decreasing molecular weight, increased materno-fetal concentration gradient and placental blood flow etc will increase the placental transfer of drugs

The relative distribution of the drug across the placenta is represented by Feto-Maternal (F/M) concentration ratio

Pethidine and diamorphine are both metabolised in the fetus to less lipid-soluble products like norpethidine and morphine respectively, which remain on the fetal side of the placenta. The elimination half-lives of these drugs are also longer in the fetus because of immature hepatic metabolism. This again prolongs its existence in the fetal side.

Lipid solubility of drugs like thiopentone sodium are high; so they cross the placenta easily, and can accumulate as the pH is lower in the fetus

Diazepam is metabolised to less lipid-soluble products. So it can have an F/ M ratio of 2 even one hour after maternal administration.

Local anaesthetic agents are weak bases which are largely UN-IONISED at physiological pH, and cross the placenta readily. Foetal ‘trapping’ occurs only in severe acidosis, when the molecules become IONIZED in the fetal side.

THE BASICS OF RESPIRATORY PHYSIOLOGY

CO2 is the most important stimulus for respiration

Receptors for CO2 are found in the medulla of the brain (central chemoreceptors)

Receptors for O2 are found mainly in carotid and aortic bodies

CO2 is the more important gas as the body has more capacity to store CO2 than O2 or hydrogen ions

In normal people at sea level, only 10% of the respiratory drive is due to hypoxic stimulation.

Unlike the central stimulation of hypercapnia, hypoxia causes central depression of the respiratory drive.

Acidosis (high H+ / low blood pH) stimulates respiration; conversely alkalosis depresses it.

For gas exchange, the lungs provide an interface of total surface area about 55 m2 via 700 million alveoli

Alveolar ventilation’ is that part of the total ventilation (i.e. all gas entering the lungs) that participates in gas exchange with pulmonary capillary blood; it is equal to total ventilation minus the ventilation of the conducting airways (i.e. dead-space ventilation).The average alveolar ventilation is about 4 L/min.

The alveolar–arterial oxygen gradient ( P(A-a)O2 ) is a measure of the oxygen that has reached the arterial blood supply as a ratio of the total oxygen in the alveoli. It is a useful index of pulmonary gas exchange function.

This requires that three elements are working correctly:

  1. Circulatory anatomy is normal. Anomalies such as ASD & PDA can cause anatomical shunting, i.e. venous blood passes through routes that are not exposed to alveolar air
  2. Ventilation and perfusion are matched
  3. The respiratory membrane allows sufficient free diffusion of gases between air and blood. A diffusion defect impairs the alveolar–capillary membrane, e.g. in interstitial lung fibrosis

In a healthy individual breathing room air (at FiO2 0.21) the PO2 in alveolar air is 104 mmHg and in arterial blood 95 mmHg . PAO2 exceeds PaO2 by 15 mmHg .Thus, at an FiO2 of 21, the P(A–a)O2 is 15 mmHg

In blood, CO2 is present as:

Dissolved in blood plasma (5.3% in arterial blood)

Bound to haemoglobin as carbaminohaemoglobin within erythrocytes (4.5%)

In the form of bicarbonate attached to a base (90%)

Reference:”Understanding ABGs & Lung Function Tests” Muhunthan Thillai, Keith Hattotuwa

REFINE YOUR IMPRESSION OF 📕PaO2 Vs 📗SaO2 Vs 📘CaO2

⭕️Oxygen content ( PaO2 ) is the pressure of oxygen molecules dissolved in blood, and is measured by ABG analysis with units of kPa or mmHg

⭕️Oxygen saturation ( SaO2 ) is a measure of the percentage of haemoglobin sites that have oxygen bound, commonly measured with a pulse oximeter

⭕️Oxygen content ( CaO2 ) is the real measure of blood oxygen quantity as it accounts for dissolved and haemoglobin bound oxygen. (i.e. CaO2 directly reflects the TOTAL number of oxygen molecules in arterial blood, both bound and unbound to hemoglobin. It is given as the volume of oxygen carried in each 100 ml blood (mL O 2 /100 mL). Normal CaO2 ranges from 16 to 22 ml O2/dl.

EXPLANATION:

⭕️Oxygen saturation ( SaO2 ) is expressed as the percentage of haemoglobin-binding sites that are occupied by oxygen, thereby forming oxyhaemoglobin.

⭕️Arterial blood is normally at 97–98% O 2 saturation (i.e. 98% of the available haemoglobin is combined with O 2 ), whereas venous blood is normally at 74% O2 saturation.

⭕️O2 constitutes 21% of the atmosphere by volume and atmospheric PO2 is 159 mmHg at sea level . At an alveolar pressure of 104 mmHg, alveolar oxygen diffuses into pulmonary venous blood and raises its O2 content from 15 mL/100 mL to 20 mL/100 mL. Of this amount 19.75 mL is combined with haemoglobin and 0.25 mL is ‘free’ or dissolved in simple solution in the plasma. At this pressure of alveolar O2 , haemoglobin in the arterial blood normally becomes 98% saturated and and 2% of the haemoglobin remains reduced, i.e. free of oxygen.

⭕️PaO2 is determined by alveolar PO2 and the state of the alveolar-capillary interface, not by the amount of hemoglobin available to soak them up. PaO2 is not a function of hemoglobin content or of its characteristics. This explains why, for example, patients with severe anemia or carbon monoxide poisoning or methemoglobinemia can (and often do) have a normal PaO2.

⭕️The most common physiologic disturbance of lung architecture, and hence of a reduced PaO2, is ventilation-perfusion (V-Q) imbalance. Less common causes are reduced alveolar ventilation, diffusion block, and anatomic right to left shunting of blood.

⭕️Think of PaO2 as the driving pressure for oxygen molecules entering the red blood cell and chemically binding to hemoglobin; the higher the PaO2, the higher the SaO2.

⭕️ In contrast to the other two variables, CaO2 depends on the hemoglobin content and is directly related to it; Since the dissolved oxygen contributes minimally to CaO2 under physiologic conditions, CaO2 is determined almost entirely by hemoglobin content and SaO2, and is related linearly to either variable.

CaO2 = Hb (gm/dl) x 1.34 ml O2/gm Hb x SaO2 + PaO2 x (.003 ml O2/mm Hg/dl).


Screen Shot 2018-09-02 at 11.15.47 AM

DESCRIPTION OF THE IMPORTANT EVENTS IN THE CARDIAC CYCLE SYNCHRONISED WITH THE EKG & VENOUS PRESSURE WAVE FORMS

1. Atrial Contraction (Phase 1): It is initiated by the P wave of the ECG which represents electrical depolarization of the atria. Atrial contraction does produce a small increase in venous pressure that can be noted as the “a-wave”. Atrial contraction normally accounts ONLY for about 10% of left ventricular filling when a person is at rest. At high heart rates when there is less time for passive ventricular filling, the atrial contraction may account for up to 40% of ventricular filling. This is sometimes referred to as the “atrial kick.” The atrial contribution to ventricular filling varies inversely with duration of ventricular diastole and directly with atrial contractility. The volume of blood at the end of the filling phase is the end diastolic volume and is around 120 mL in the adult. S4 sound is caused by vibration of the ventricular wall during atrial contraction. Generally, it is noted when the ventricle compliance is reduced (“stiff” ventricle) as occurs in ventricular hypertrophy and in many older individuals.

2. Isovolumetric Contraction (Phase 2): This phase of the cardiac cycle begins with the appearance of the QRS complex of the ECG, which represents ventricular depolarization. The AV valves close when intraventricular pressure exceeds atrial pressure. Closure of the AV valves results in the first heart sound (S1). During the time period between the closure of the AV valves and the opening of the aortic and pulmonic valves, ventricular pressure rises rapidly without a change in ventricular volume (i.e., no ejection occurs). Ventricular volume does not change because all valves are closed during this phase. Contraction, therefore, is said to be isovolumetric. The “c-wave” noted in the venous pressure may be due to bulging of A-V valve leaflets back into the atria. Just after the peak of the c wave is the x’-descent.

3. Rapid Ejection (Phase 3): Ejection begins when the intraventricular pressures exceed the pressures within the aorta (80 mm of Hg) and pulmonary artery, which causes the aortic and pulmonic valves to open. Left atrial pressure initially decreases as the atrial base is pulled downward, expanding the atrial chamber. Blood continues to flow into the atria from their respective venous inflow tracts and the atrial pressures begin to rise. This rise in pressure continues until the AV valves open at the end of phase 5.

4. Reduced Ejection (Phase 4): Approximately 200 msec after the QRS and the beginning of ventricular contraction, ventricular repolarization occurs as shown by the T-wave of the electrocardiogram. Repolarization leads to a decline in ventricular active tension and pressure generation; therefore, the rate of ejection (ventricular emptying) falls. Ventricular pressure falls slightly below outflow tract pressure; however, outward flow still occurs due to kinetic (or inertial) energy of the blood. Left atrial and right atrial pressures gradually rise due to continued venous return from the lungs and from the systemic circulation, respectively.

5. Isovolumetric Relaxation (Phase 5): When the intraventricular pressures fall sufficiently at the end of phase 4, the aortic and pulmonic valves abruptly close (aortic precedes pulmonic) causing the second heart sound (S2) and the beginning of isovolumetric relaxation. Valve closure is associated with a small backflow of blood into the ventricles and a characteristic notch (incisura or dicrotic notch) in the aortic and pulmonary artery pressure tracings. Although ventricular pressures decrease during this phase, volumes do not change because all valves are closed. The volume of blood that remains in a ventricle is called the end-systolic volume and is ~50 ml in the left ventricle. The difference between the end-diastolic volume and the end-systolic volume is ~70 ml and represents the stroke volume. Left atrial pressure (LAP) continues to rise because of venous return from the lungs. During isovolumetric ventricular relaxation, atrial pressure rises to 5 mmHg in the left atrium and 2 mmHg in the right atrium.

6. Rapid Filling (Phase 6): As the ventricles continue to relax at the end of phase 5, the intraventricular pressures will at some point fall below their respective atrial pressures. When this occurs, the AV valves rapidly open and passive ventricular filling begins. The opening of the mitral valve causes a rapid fall in LAP. The peak of the LAP just before the valve opens is represented by the “v-wave.” This is followed by the y-descent of the LAP. A similar wave and descent are found in the right atrium and in the jugular vein. In some patients a third heart sound (S3) is audible during rapid ventricular filling, and is often pathological in adults and is caused by ventricular dilatation.

7. Reduced Filling (Phase 7): As the ventricles continue to fill with blood and expand, they become less compliant and the intraventricular pressures rise. The increase in intraventricular pressure reduces the pressure gradient across the AV valves so that the rate of filling falls late in diastole. In normal, resting hearts, the ventricle is about 90% filled by the end of this phase. In other words, about 90% of ventricular filling occurs before atrial contraction (phase 1) and therefore is passive.

8. Right Vs Left: The major difference between the right and left side of the cardiac chambers, is that the peak systolic pressures of the right heart are substantially lower than those of the left heart, and this is because pulmonary vascular resistance is lower than systemic vascular resistance. Typical pulmonary systolic and diastolic pressures are 24 and 8 mm Hg, respectively.

9. Jugular Venous Pressure Summary: Right atrial pressure pulsations are transmitted to jugular veins. Thus, atrial contractions produce the first pressure peak called the a wave. Shortly there- after, the second peak pressure called the c wave follows and this is caused by the bulging of the tricuspid valve into the right atrium. After the c wave, the right atrial pressure decreases (‘x’ descent) because the atrium relaxes and the tricuspid valve descends during ventricular emptying. As the central veins and the right atrium fill behind a closed tricuspid valve, the right atrial pressure rises towards a third peak, the v wave. When the tricuspid valve opens at the end of ventricular systole, right atrial pressure decreases again as blood enters the relaxed right ventricle (‘y’ descent). The right atrial pressure begins to rise shortly as blood returns to the right atrium and the right ventricle together during diastole.

Ref: Principles of Physiology for the Anaesthetist, Peter Kam, Ian Power, http://www.cvphysiology. com

#CardiacCycle , #Physiology , #Anesthesia

VOCAL CORD PALSIES

Under normal circumstances, the vocal cords meet in the midline during phonation. On inspiration, they move away from each other. They return toward the midline on expiration, leaving a small opening between them. When laryngeal spasm occurs, both true and false vocal cords lie tightly in the midline opposite each other.

The recurrent laryngeal nerve (RLN) carries both abductor and adductor fibers to the vocal cords.

Selmon’s law: The abductor fibers are more vulnerable, and moderate trauma causes a pure abductor paralysis. Severe trauma causes both abductor and adductor fibers to be affected. N.B.:- Pure adductor paralysis does not occur as a clinical entity.

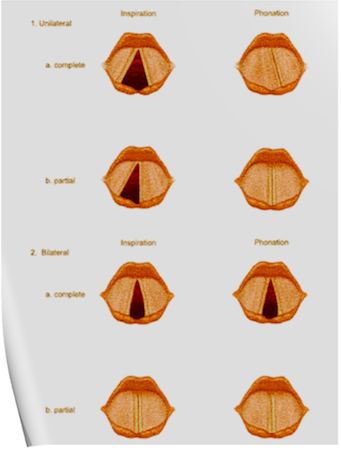
Scenario 1- PURE UNILATERAL ABDUCTOR PALSY: As adduction is still possible on the affected side, the opposite cord come and meet in the midline on phonation. However, only the normal cord abducts during inspiration.

Scenario 2- COMPLETE UNILATERAL PALSY OF THE RLN: Both abductors and adductors are affected. On phonation, the unaffected cord crosses the midline to meet its paralyzed counterpart, appearing to lie in front of the affected cord. On inspiration, the unaffected cord moves to full abduction.

Scenario 3- BILATERAL INCOMPLETE ABDUCTOR PALSY: When there is incomplete bilateral damage to the recurrent laryngeal nerve, the adductor fibers draw the cords toward each other, and the glottic opening is reduced to a slit, resulting in severe respiratory distress.

Scenario 4- COMPLETE BILATERAL PALSY OF THE RLN: With a complete palsy, each vocal cord lies midway between abduction and adduction, and a reasonable glottic opening exists.

Thus, bilateral incomplete palsy is more dangerous than the complete variety.

Scenario 5- DAMAGE TO SUPERIOR LARYNGEAL NERVE/S: Damage to the external branch of the superior laryngeal nerve or to the superior laryngeal nerve trunk causes paralysis of the cricothyroid muscle (the tuning fork of the larynx), resulting in hoarseness that improves with time because of increased compensatory action of the opposite muscle. The glottic chink appears oblique during phonation. The aryepiglottic fold on the affected side appears shortened, and the one on the normal side is lengthened. The cords may appear wavy. The symptoms include frequent throat clearing and difficulty in raising the vocal pitch.

Scenario 6- TOTAL BILATERAL PARALYSIS OF VAGUS NERVES: This affects the recurrent laryngeal nerves and the superior laryngeal nerves. In this condition, the cords assume the abducted, cadaveric position. The vocal cords are relaxed and appear wavy. A similar picture may be seen after the use of muscle relaxants.

Screen Shot 2018-06-26 at 11.01.24 PM

N.B:- Topical anesthesia of the larynx may affect the fibers of the external branch of the superior laryngeal nerve and paralyze the cricothyroid muscle, signified by a “gruff” voice. Similarly, a superior laryngeal nerve block may affect the cricothyroid muscle in the same manner as surgical trauma does.

Reference: Benumof and Hagberg’s Airway Management, Third edition