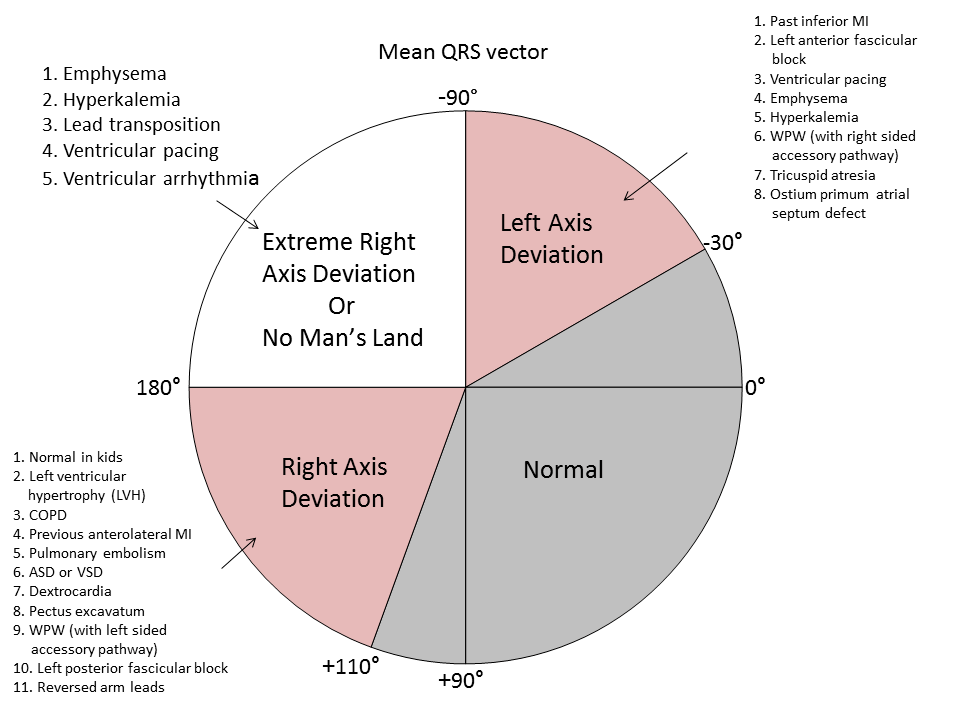
VIVA SCENE: THROMBOELASTOGRAPHY (TEG) AND OTHER QUESTIONS

TEG is a relatively new modality for monitoring coagulation which is very useful during management of trauma and also in the perioperative scenario..

BASIS:

  • The 2 main components of the TEG machine are a cup and a pin. Whole blood is mixed with the activating agent kaolin as well as calcium. The cup then oscillates around the pin slowly, at a rate of 6 times per minute, to mimic natural blood flow in vivo and activate the clotting cascade. As the clot forms, the torque between the cup and pin is transduced and measured, creating a curve. As the clot breaks down and torque decreases, the tracing converges to represent this. 
  • The different parameters of the curve are then measured to assess current coagulation status.
  • Of the 4 types of TEG assays available, the most common is the rapid TEG. The use of an activator in rapid TEG standardizes the TEG test and speeds up the rate at which clotting takes place, thus making results available more quickly.

INTERPRETATION

Screen Shot 2019-09-04 at 3.20.39 pm

Screen Shot 2019-09-04 at 3.04.41 pm

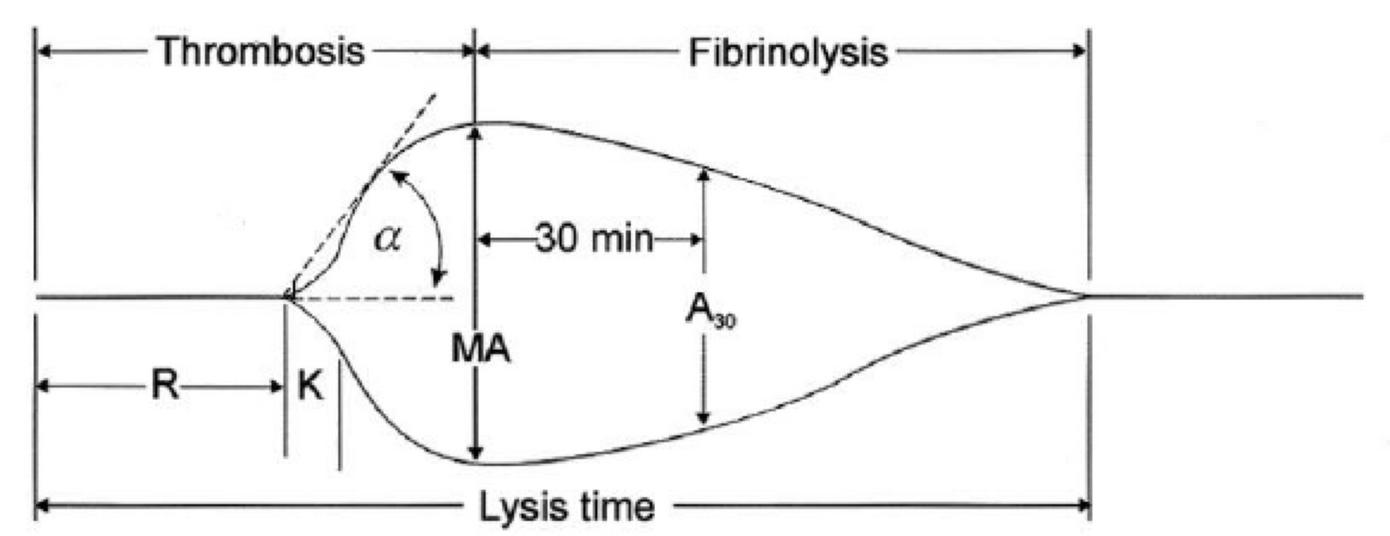
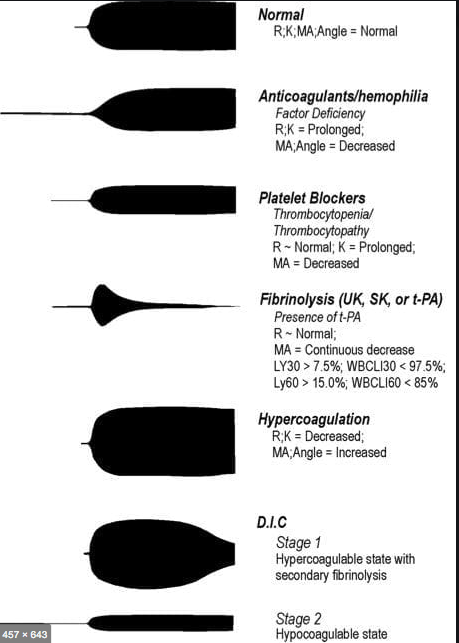
  • R(sec): The first measurement of note is the reaction time (R time). This is the time interval from the start of the test to the initial detection of the clot. Normal R values range between 7.5 and 15 minutes. A prolonged R time may indicate hemodilution or clotting factor deficiencies. The treatment for prolonged R time is to administer FFP as it contains all factors of the coagulation cascade, without further coagulant hemodilution A shortening of R time (< 3 minutes) occurs in hypercoagulable states. Examples would be patients with early disseminated intravascular coagulation (DIC) or septicemia. In these situations, free thrombin is released into the circulating blood, triggering the clotting mechanisms but the patient later begins to bleed because of exhaustion of clotting factors.

  • K (sec) and Angle α (°): The clot strength is measured by these 2 variables in TEG. The K value measures the interval between the R time and the time when the clot reaches 20 mm. Normal K values range between 3 and 6 minutes. Prolongation of the K value with normal platelet count  indicates inadequate amounts of fibrinogen to form fibrin. The treatment for prolonged K value is therefore to administer fibrinogen/cryoprecipitate. The α angle measures a line tangent to the slope of the curve during clot formation.The alpha angle represents the thrombin burst and conversion of fibrinogen to fibrin. Normal α value is between 45° and 55°. A longer K value causes a shallow or more acute angle (<45°), while a shorter K value causes a steeper α angle (>45 °). An angle α <45° suggests a less vigorous association of fibrin with platelets. In this case, treatment begins much higher on the coagulation cascade, with the replacement of both fibrinogen and factor VIII. Thus, these patients can be treated with the administration of cryoprecipitate. Shortening of the K-value indicates a very quick formation of clot, potentially due to hypercoagulability or inappropriate consumption of coagulation factors. A shortened K value also corresponds to a steeper α (>45°). The treatment for shortened K and steeper α is anticoagulation therapy

  • MA (mm): Maximum amplitude is a measurement of maximum clot strength and provides information on both fibrinogen and platelet function. As the clot develops and increases in tensile strength due to platelet activation and binding to fibrin, the tracing increases it’s MA or appears to widen. Normal values are between 50–60 mm. 80% of the MA is derived from platelet function whereas the remaining 20% is derived from fibrin. A low MA value is indicative of low clot strength, which can be caused by decreased fibrinogen levels, low platelet counts, or decreased platelet function. (i) Paired with a prolongation of K value, this could be a sign of the need for cryoprecipitate. (ii) Administration of platelets may be avoided when a low platelet count is combined with a normal MA value (=platelet function is normal) (iii) Treatment with platelets may be indicated for patients with a low MA value (=low platelet function) and normal platelet count. (iv) High MA will occur in the setting of hyperactivity of platelets, and MA above 75 mm indicates a prothrombotic state. In this case, treating with an anticoagulant would be helpful
  • Shear Elastic Modulus Strength, G value or G: is a measure of clot strength or clot firmness, and is calculated based on the amplitude value (A) until the maximum amplitude (MA) is reached. It is the single most important value of the entire assay because it represents the overall function or effectiveness of the clot. Normal G values are between 5.3 and 12.4 dynes/cm2. A G value >10 dynes/cm2 indicates increased risk of thrombosis. Treatment for high G is accomplished by the use of platelet inhibitors such as Clopidogrel or Aspirin. Aspirin is usually not preferred because it inhibits platelet adherence rather than platelet aggregation. A G <5 dynes/cm2 places a patient at increased risk of hemorrhage
  • As time progresses during the TEG assay, the tracing will remain at maximal amplitude for a period of time, after which clot lysis begins. Normally, lysis continues for a period of up to 15 minutes. A computerized algorithm automatically estimates the percentage of lysis occurring over time. This is called the Estimated Percentage of Lysis or EPL. After 30 minutes, EPL becomes EPL30 or succinctly LY30 (i.e. percentage of lysis at 30 minutes). Both the EPL and LY30 are measurements of excessive fibrinolysis since they measure the percentage decrease in amplitude after MA. An EPL between 7.5 and 15%, when accompanied by a very high G, reflects a hyperfibrinolytic and hypercoagulable state typical of patients with early DIC. A very high EPL or LY30 (>20%) may indicate the need for antifibrinolytic therapy, such as the use of transexamic acid or aminocaproic acid. LY30 is also useful for patients undergoing thrombolytic drug therapy. This can be observed by rapid curve convergence.

Ref: Thromboelastography: Clinical Application, Interpretation, and Transfusion Management, Shawn Collins et al AANA Journal Course, 2016

HOW DO WE TEST CLOTTING?

  • By doing tests like aPTT, PT & INR, Platelet Count, ACT, Bleeding Time, fibrinogen and factor levels, TEG etc
  • The aPTT and INR use different reagents to measure the time to form a clot in vitro after platelet-poor plasma from blood collected in a calcium chelating tube, is recalcified
  • The aPTT is prolonged with the deficiency of factors of the intrinsic pathway: Fs 8,9,11,12. Also the factors involved in the common pathway (Fs 1,2,10)e.g. Heparin therapy, DIC, liver disease
  • The INR is prolonged especially with deficiency of F 7; but also with deficiency of Fs 1,2,5,10 e.g.  warfarin therapy, vitamin K deficiency, DIC, liver disease
  • N.B Warfarin inhibits the gamma carboxylation of vitamin K dependent factors 2,7,9,10
  • BLEEDING TIME :Duke’s method: Sterilize the finger tip using rectified spirit and allow to dry. Make a sufficiently deep prick using a sterile lancet, so that blood comes out freely without squeezing. Note the time (start the stop-watch) when bleeding starts. Mop the blood by touching the finger tip with a filter paper. This is repeated every 15 seconds, each time using a fresh portion of the filter paper, till bleeding stops. Note the time (stop the stop-watch). Normal value is upto 4 minutes. 
  • CLOTTING TIME: Capillary tube method: (Wright’s method). Under sterile precautions make a sufficiently deep prick in the finger tip. Note the time when bleeding starts (start the stop watch). Touch the blood drop at the finger tip using one end of the capillary tube kept tilted downwards. The tube gets easily filled by capillary action. After about two minutes start snapping off small lengths of the tube, at intervals of 15 seconds, each time noting whether the fibrin thread is formed between the snapped ends. Note the time (stop the stop watch) when the fibrin thread is first seen. Clotting time is the interval between the moment when bleeding starts and the moment when the fibrin thread is first seen.

    Normal value is 3 to 10 minutes.

  • Bleeding time depends on the integrity of platelets and vessel walls, whereas clotting time depends on the availability of coagulation factors

MONITORING OF NEUROMUSCULAR BLOCKADE

  • ASSESSMENT OF NEUROMUSCULAR FUNCTION
  • CLINICAL:
  • Grip strength
  • Ability to sustain head lift for at least 5 seconds
  • Ability to produce vital capacity of at least 10 mL/kg
  • NEUROMUSCULAR STIMULATION EQUIPMENTS:
  • Peripheral nerve stimulator
  • Mechanomyography: uses force transducer to quantitatively measure contractile response
  • Acceleromyography: measures movement of joints caused by muscle movement
  • Electromyography: measures electrical activity associated with action potential propagation in a muscle cell (research use)
  • BENEFITS
  • Monitoring helps to assess the degree of relaxation, help adjust dosage, assess development of phase II block, provide early recognition of patients with abnormal cholinesterases, and to assess cause of apnoea.
  • All twitches that we deliver in theatre with the nerve stimulators are uniform
    and so we only need to learn a couple of facts.
    • All twitches are delivered at 50 mA (i.e. supramaximal stimulus)
    • All twitches last 0.2 ms
    Once we have these facts, the rest becomes easier to remember
  • TYPES
  • Single twitch is insensitive since >75% of postsynaptic receptors must be blocked before there is any diminution in twitch height. We will not see ‘fade’ during single-twitch stimulation. >> Twitch current 50 mA. Duration of twitch 0.2 ms. Frequency of twitches 1 Hz (i.e. 1 every second). Number of twitches: as many as operator chooses to give. Single twitch can be used to assess block in depolarising nmbd, i.e.
    suxamethonium, where fade and post-tetanic facilitation do not occur
  • Train of four: >>Twitch current 50 mA. Duration of twitch 0.2 ms. Frequency of twitches 2 Hz (i.e. 2 every second). Number of twitches: 4. Compare last (T4) and first twitch (T1). TO4 ratio (T4 :T1) indicates degree of neuromuscular blockade:
  • – T 4 disappears at 75% depression of T 1 (1st, 2nd and 3rd twitches present)
  • – T 3 disappears at 80% depression of T 1 (1st and 2nd twitches present)
  • – T 2 disappears at 90% depression of T 1 (1st twitch only)
  • – T 1 disappears at 100% depression of T 1 (no twitches).
  • A TO4 count of 0–1 is needed for adequate intubating conditions, but a count of three twitches provides adequate relaxation for most surgery (To4 ratio of 0.15 – 0.25) To4 ratio of > 0.9: essential for safe extubation and recovery post surgery
  • A TO4 ratio >0.70, corresponds to adequate clinical recovery, but normal pharyngeal function requires a ratio >0.90.
  • Neuromuscular reversal can be given when T2 has reappeared, i.e. when T1 is about 20% of its control height.
  • The diaphragm is the most resistant (but with shorter onset times) of all muscles to both depolarising and non-depolarising relaxants requiring 1.5 to 2 times as much drug as the adductor pollicis muscle for an identical degree of blockade.
  • A supramaximal stimulus should be truly maximal throughout the test period to maintain accuracy; hence the electrical current applied is at least 20% to 25% above that necessary for a maximal response.
  • Tetanic stimulation: >> Twitch current 50 mA. Duration of twitch 0.2 ms. Frequency of twitches 50 Hz (i.e. 50 every second). Number of twitches: stimulation lasts 5 seconds = 5 × 50 = 250 twitches. With non-depolarizing block, peak height is reduced and fades. Release of acetylcholine is reduced (possibly presynaptic effect) and postsynaptic receptors are blocked, limiting sustained contraction. Tetanic stimulation is extremely painful in an awake patient and may leave an unpleasant sensation in those who were anaesthetised.
  • Post-tetanic count: >> Twitch current 50 mA. Duration of twitch 0.2 ms. Frequency of twitches 1 Hz (i.e. 1 every second). Number of twitches: as many as operator chooses to give. May result in response (post-tetanic potentiation), even if none is seen with original TO4. Due to increased synthesis and mobilization of acetylcholine following tetanus. Appearance of post-tetanic count precedes return of TO4 by 30–40 min.PTC < 5 = profound block. PTC >15 = equivalent to two twitches on To4
  • Double-burst stimulation: >> Twitch current 50 mA. Duration of twitch 0.2 ms. Frequency of twitches 50 Hz (i.e. 50 every second). Number of twitches: 3 twitches – break of 750 ms – 3 more twitches. Similar to TO4, but tactile evaluation is more sensitive because fade of the two resultant contractions is more marked.
  • Nondepolarising neuromuscular blocking agents (NDMB): repetitive stimulation (ToF or tetanus) is associated with fade (reduction in amplitude of evoked responses with T4 affected first, then T3, followed by T2, then finally T1) and post-tetanic facilitation.
  • Depolarising neuromuscular blocking agents (DMB): no fade or posttetanic facilitation observed. Repeated dose of suxamethonium can give characteristics of NDMB—phase II block).
  • A PNS is Portable, battery-powered, and easy to use Able to deliver different impulses. Supramaximal current output of 50–60 mA at all frequencies can be given to ensure all nerve fibres are depolarised. Has a Monophasic square waveform. Can give Single twitch at 0.1 Hz, Train of four (TOF) at 2 Hz and Tetanic stimulation at 50 Hz
  • Fade: A gradual diminution of evoked response during prolonged or repeated nerve stimulation, is indicative of a nondepolarizing block. Adequate clinical recovery correlates well with the absence of fade.
  • PHASE I and PHASE II  Blocks: These terms refer to the blocks seen following the administration of suxamethonium. A phase I block describes the block seen following the administration of a single dose of suxamethonium. Suxamethonium binds to the ACh receptor, which causes opening of the sodium channel and membrane depolarisation. This results in disorganised muscle contraction, seen as fasciculation followed by flaccid paralysis because suxamethonium causes prolonged depolarisation of the motor end plate. The characteristics of a phase I block:

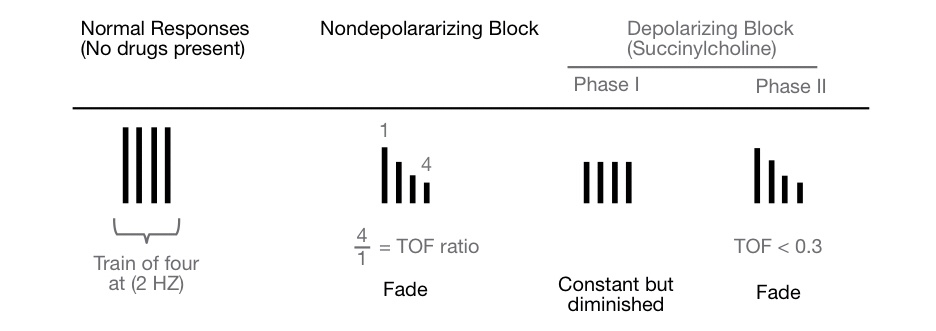
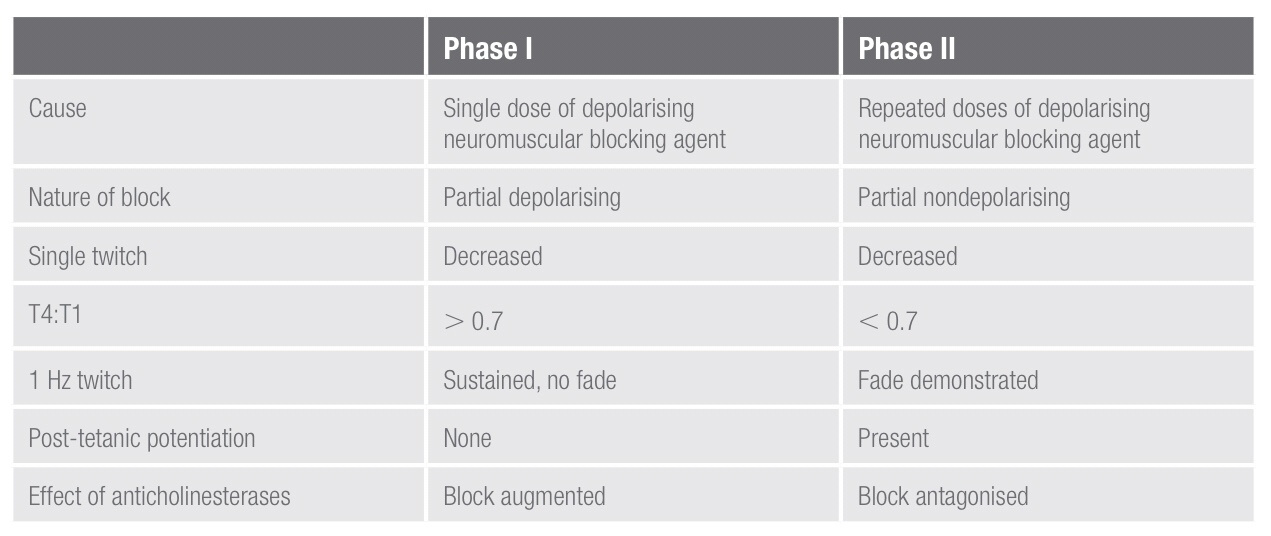
• Reduced twitch height, but sustained response to tetanic stimulation
• No post-tetanic facilitation; does not exhibit fade during tetanus or train-of-four

• TOF ratio >70% (height of fourth twitch to that of first). This is a measure of the pre-synaptic effect of suxamethonium.
The block is potentiated by the effect of anticholinesterases because these
will further decrease the rate of suxamethonium breakdown.
A phase II block describes the block seen following the repeated administration/infusion of suxamethonium and can develop with doses
in excess of 2.5 mg/kg. It occurs because in the continued presence
of suxamethonium, the receptors eventually close and the membrane
repolarises, at least partially. However, it is now desensitised to ACh and so
cannot open again to propagate an action potentials. In this way, a phase II
block is similar to a non-depolarising block. Phase ii blocks are also called
‘desensitisation blocks’.
characteristics of a phase ii block:
• Exhibits fade on tetanic stimulation
• Exhibits post-tetanic facilitation
• TOF ratio < 0.3 (fourth to first twitch height)
• Antagonised by anticholinesterases
• Tachyphylaxis is seen with the need to increase suxamethonium infusion
rate or bolus dose.

  • Post-tetanic potentiation: Tetanic stimulation is a supra-maximal stimulation, applied to the NMJ for a prolonged period of time. It is sufficient to produce a substantial increase in ACh release, enough to overcome competition from NMBA in all but the most profound of blocks. The positive feedback mechanism via prejunctional receptors by stimulating an increase in ACh production by second messenger systems gets activated and this increases the amount of ACh available for release. This is called post-tetanic potentiation.
  • Commonly monitored nerves in theatre are:
    • Facial nerve – twitch of the eyebrow with orbicularis oculi contraction
    • Ulnar nerve – twitch of the thumb with adductor pollicis contraction
    • Posterior tibial nerve – twitch of the big toe with flexor hallucis brevis contraction
  • Which muscles are affected first by NMBAs?
    NMBAs cause paralysis of all voluntary muscles in the body, but some are
    more sensitive than others. in order of decreasing sensitivity:
    • Eyes (affected first)
    • Facial muscles
    • Neck
    • Extremities
    • Limbs
    • Abdominal muscles
    • Glottis
    • Intercostal muscles (affected last).
    Muscle function returns in the reverse order. This is why it is traditional to
    wait until a patient can lift their head of the pillow before extubation

MEASUREMENT OF CORE BODY TEMPERATURE: FAQs

What’s the problem, if we place the temperature probe in upper 1/3rd or 2/3rd of the esophagus?

Esophageal temperature should be taken from the lower third of the oesophagus; placed above this level, the probe may under-read due to cooling effect of inspired gases. It gives a good estimate of cerebral blood temperature.

What’s the advantage of nasopharyngeal temperature measurement over oesophageal measurement?

The nasopharyngeal temperature probe is placed just behind the soft palate. The advantage is that it is more accessible compared to the oesophageal temperature measurement. The disadvantage is that it is less accurate in representating the core temperature.

What are the advantages of measurement of temperature @ Tympanic membrane?

The tympanic membrane provides an accurate representation of hypothalamic temperature. It is less invasive, has a short response time and correlates well with oesophageal temperature. But it does not allow continuous measurements.

What is the best method for CONTINUOUS measurement of core temperature?

Blood temperature measurement using a pulmonary artery flotation catheter

What are the factors reducing the accuracy of Rectal temperature measurement?

Rectal temperature is influenced by heat generated from gut flora, the cooling effect of blood returning from the lower limbs and the insulation of the probe by faeces. It is normally about 0.5–1.0 ° C higher than core temperature and has a slow response time.

Can you say an e.g. of utilising the temperature gradients existing between different sites of the body for clinical advantage?

The gradient between a skin temperature and a core temperature can be used as a marker of peripheral perfusion.

A FEW POINTS ABOUT A SHARED LUNG

🔸In the pregnant patient, the respiratory function deviates from the normal

🔸There is increased CO2 production by the mother and the foetus; but mostly you see a respiratory alkalosis. Why?
🔸This is because the stimuli from the raised pCO2 levels and that by the respiratory stimulant, progesterone, sets the minute ventilation approximately 30% higher than the normal levels and this is more than what is needed to compensate for the increased CO2 production 
🔸It is mainly the reduction in FRC (a reduction by 10-25% ; appears by 12th week ; is due to the reduced chest wall compliance ; lung compliance is normal ) which makes the patient more vulnerable to hypoxia.
🔸The alveolar diffusing capacity is reported to be normal during pregnancy 

BE SENSITIVE ENOUGH TO SENSE SSEP (SOMATO SENSORY EVOKED POTENTIAL)❗️❗️

SSEP reflect the ability of a specific neural pathway to conduct an electrical signal from the periphery to the cerebral cortex.
👉🏿THIS IS WHAT WE DO:
A skin surface electrode is placed near a major peripheral mixed function (motor and sensory) nerve ; median and ulnar nerves are usually stimulated at the wrist overlying the path of the respective nerves with 2 electrodes (needle or surface), separated by 2 cm, with the cathode proximal and the anode distal –> a square-wave electrical stimulus of 0.2 to 2ms is applied at a rate of 1 to 2Hz. –> The stimulus intensity is adjusted to produce minimal muscle contraction (usually 10 to 60mA) –> The resulting electrical potential is recorded at various points along the neural pathway from the peripheral nerve to the cerebral cortex.
👉🏿COMMON SITES OF STIMULATION:
🔻Upper extremity : median and ulnar nerves at the wrist.
🔻Lower extremity : the common peroneal nerve at the popliteal fossa and the posterior tibial nerve at the ankle.

🔻Less commonly the tongue, trigeminal nerve, and pudendal nerve have been studied.

👉🏿RECORDING:
After upper limb stimulation, potentials are recorded at the brachial plexus (Erb’s point, 2 cm superior to the clavicular head of the sternocleidomastoid muscle), the cervicomedullary junction (posterior midline of the neck at the second cervical vertebra), and the scalp overlying the somatosensory cortex on the contralateral side.
After stimulation of the lower extremity, potentials are recorded at the popliteal fossa, lumbar and cervical spinal cord, and somatosensory cortex. It is important to record nerve and subcortical potentials to verify adequate stimulation and delineate anesthetic effects.
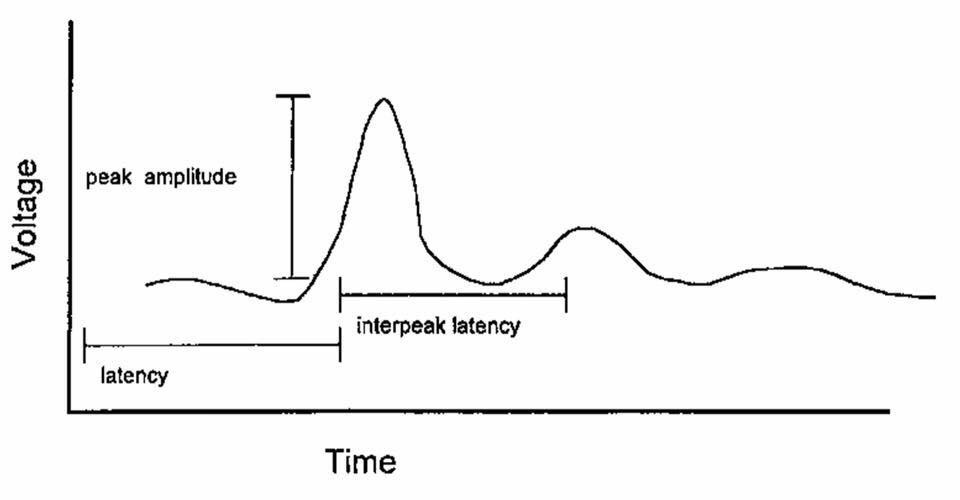
👉🏿PLOTTING:
The SSEP is plotted as a waveform of voltage vs. time.
It is characterized by:

# Amplitude (A), which is measured in microvolts from baseline to peak or peak to peak
# Latency (L), which is the time, measured in milliseconds, from onset of stimulus to occurrence of a peak or the time from one peak to another
👉🏿MORPHOLOGY:
described as positive (P, below the baseline) or negative (N, above the baseline)
A waveform is identified by the letter describing its deflection above or below the baseline followed by a number indicating its latency (e.g., N20)
👉🏿INTRAOPERATIVE SSEP’s, INDICATIVE OF SURGICAL TRESSPASS / ISCHEMIA INCLUDE
a . increased latency

b . decreased amplitude

c . complete loss
Any decrease in amplitude greater than 50% or increase in latency greater than 10% may indicate a disruption of the sensory nerve pathways. The spinal cord can tolerate ischemia for about 20 minutes before SSEPs are lost.
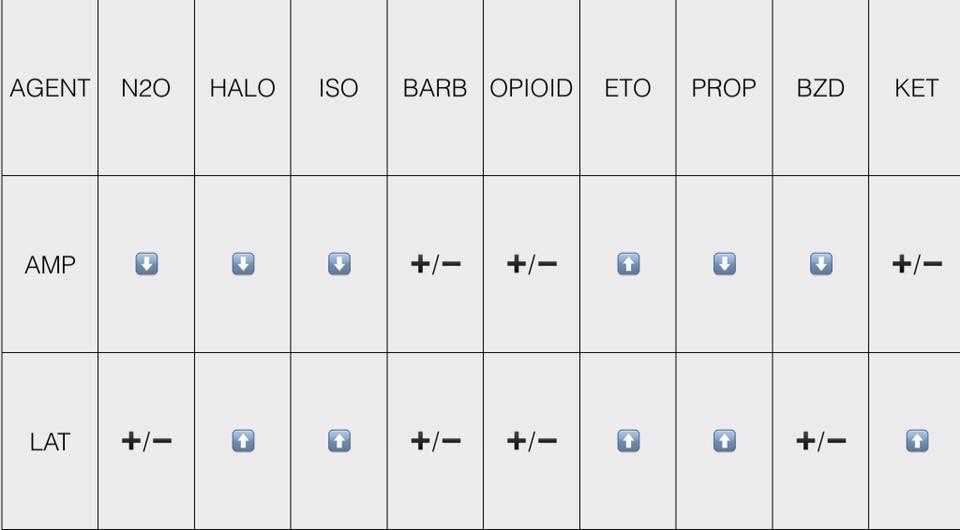
👉🏿ANESTHETIC DRUGS AND SSEP
All of the halogenated inhaled anesthetics probably cause roughly equivalent dose-dependent decreases in amplitude and increases in latency that are further worsened by the addition of 60% nitrous oxide. It is best to restrict the use of volatile anesthetics and nitrous oxide to levels below 1 minimum alveolar concentration (MAC) and not to combine the two. n If possible, bolus injections of drugs should be avoided, especially during critical stages of the surgery. Continuous infusions are preferable.
👉🏿CONDITIONS ALTERING SSEP
# Hypothermia : increases latency, whereas amplitude is either decreased or unchanged. For each decrease of 1 degree C, latency is increased by 1ms.
# Hyperthermia (4 degree C) : decreases amplitude to 15% of the normothermic value.
# Hypotension: With a decrease of the mean arterial blood pressure (MAP < 40mm Hg), progressive decreases in amplitude are seen. The same change is also seen with a rapid decline in MAP to levels within the limits of cerebral autoregulation.
# Hypoxia: ?Decreased amplitude
# Hypocarbia: Increased latency has been described at an end-tidal CO 2 < 25mm Hg.
# Isovolumic hemodilution: Latency is not increased until the hematocrit is < 15%, and amplitude is not decreased until the hematocrit is < 7%. This effect is likely caused by tissue hypoxia.
👉🏿INTRAOPERATIVE USES
🔻scoliosis surgery & Harrington rod placement

🔻spinal cord decompression and stabilisation after acute SCI spinal fusion

🔻brachial plexus exploration following acute injury

🔻resection of spinal cord tumours, cysts & vascular anomalies

🔻correction of cervical spondylosis

🔻resection of 4 th ventricular cysts

🔻release of tethered spinal cord

🔻resection of acoustic neuroma

🔻resection of intracranial lesions involving the sensory cortex

🔻resection of thalamic tumours

🔻abdominal and thoracic aneurysm repair
👉🏿IF SSEP CHANGES SIGNIFICANTLY, WHAT THE SURGEON AND ANAESTHESIOLOGIST CAN DO TO DECREASE THE INSULT?
The anesthesiologist can:

🔻Increase mean arterial blood pressure, especially if induced hypotension is used.

🔻Correct anemia, if present.

🔻Correct hypovolemia, if present.

🔻Improve oxygen tension.

🔻Correct hypothermia, if present.
The surgeon can:

🔻Reduce excessive retractor pressure.

🔻Reduce surgical dissection in the affected area.

🔻Decrease Harrington rod distraction, if indicated.

🔻Check positioning of associated instrumentation (e.g., screws, hooks).
🌀If changes in the SSEPs persist despite corrective measures, a wake-up test may be performed to confirm or refute the SSEP findings. The patient’s anesthetic level is lightened, and a clinical assessment of neurologic function is performed. The monitoring of motor-evoked potentials along with SSEPs provides a more complete assessment of neural pathway integrity. As the sensory pathways are supplied predominantly from the posterior spinal artery & the motor tracts from the anterior, a significant motor deficit can develop without significant change in SSEP’s.


#ssep ,#neuroanaesthesia , #anaesthesia , #neuromonitoring , #evokedpotential

HOW EVOKED POTENTIALS BEHAVE , WHEN BRAIN SUFFERS FROM ISCHEMIA ❓

🕶Cerebral ischemia slows neurotransmission and neuronal energy metabolism, resulting in decreased amplitude and increased latency of specific peaks. 

🕶For SSEPs, a 50% reduction in amplitude and/or a 10% increase in latency [changes in the central conduction times, namely, the interpeak latencies between the N14 and N20 peaks] of SSEP signals from the baseline are generally accepted to be a significant change 
🕶A 50% reduction on SEP amplitude has been shown to occur when cerebral blood flow decreases below 14 mL/100 g/min 
🕶MEP have less well-defined warning criteria as compared to SSEPs; however, increased stimulus thresholds and/or decreased MEP amplitudes in relation to dramatic events (i.e., clip application) are indicative of pending neurologic insult. 
🕶For BAEP, an increase in latency of more than 1 msec, particularly in wave V, is considered to be clinically significant. 
🕶Unlike #EEG monitoring the evoked potential tests can detect subcortical functional status by way of perforating branches such as the anterior choroidal and medial striate arteries 
Reference: Anesthesiology Research and Practice Volume 2014, Article ID 595837, Controversies in the Anesthetic Management of Intraoperative Rupture of Intracranial Aneurysm, Tumul Chowdhury, Andrea Petropolis,Marshall Wilkinson, Bernhard Schaller Nora Sandu and Ronald B. Cappellani
#neuroanaesthesia , #neuroanesthesia , #EvokedPotential , #neurosurgery , #anesthesiologist , #anesthesia .

INTRACRANIAL PRESSURE ( #ICP ) MEASUREMENT & HOW IT CAN GUIDE THERAPY❓

🔸ICP data can be used to

✔️predict outcome and evolution of intracranial pathology
✔️calculate and manage cerebral perfusion pressure (CPP) [without an ICP monitor, CPP is not known].
✔️direct management strategies, and
✔️limit the use of potentially deleterious therapies.
🔸Cerebral herniation is a pressure issue and an ICP monitor may allow early detection; it is preferable to avoid herniation than to treat it
🔸Information from an ICP monitor may provide useful information to guide patient care. For example, a patient with a worrisome-appearing CT scan who does not have intracranial hypertension may not require the same degree of treatment as a patient with a similar scan but elevated ICP. Similarly, a patient with elevated ICP that is refractory to escalating management becomes an early candidate for “second tier” treatments or if very high, even withdrawal of care.
🔸ICP values have prognostic value and so it can guide management and discussions with the family about outcomes
🔸Even transient episodes of severely raised ICP and ischemia can be devastating to the traumatized brain, making it critical to accurately and continuously monitor ICP & CPP. Because insertion of intraparenchymal ICP monitors is safe, the ability to monitor CPP per se is a supportable argument for widespread ICP monitoring.
🔸Perhaps more important than a single ICP threshold may be a trend over time, ICP waveform analysis, or whether the ICP value is associated with other detrimental effects.
🔸When both ICP and brain oxygen are treated, the outcome may be better than if just ICP is treated after TBI
🔸The ICP waveform is a modified arterial pressure tracing
🔸 It has 3 peaks: P1, P2 & P3
🔸 P1 is a result of transmitted pressure from choroid plexus
🔸 The amplitude of P2 changes with brain compliance. If compliance is poor, amplitude will be high ( can even exceed that of P1) and vice versa
🔸P3 represents the dicrotic notch
🔸 Lundberg (A) or Plateau waves are steep rise of ICP to over 50 mm of Hg and lasting for 5-20 minutes; then it falls abruptly. Are Always pathological and indicates significantly reduced compliance
🔸 Lundberg (B) waves are oscillations occurring every 1-2 minutes where ICP rises to over 20-30 mm of Hg from baseline in a crescendo manner. They are supposed to be result of altered cerebral (B)lood volume and altered tone of cerebral (B)lood vessels
🔸 Lundberg (C) waves are oscillations whose amplitude is less than that of B waves and are supposed to result because of interactions between cardiac and respiratory (C)ycles. They occur also in healthy individuals
METHODS OF MEASUREMENT OF ICP
➿ Intraventricular catheter – ventriculostomy represents the “gold standard” for pressure measurement

✔️Normally placed in the frontal horn of lateral ventricle
✔️Allows therapeutic CSF drainage
✔️Creates a pathway for infection
✔️In case of the Integra Neuroscience external drainage catheter, ICP readings are based on a fluid-filled transduction system that transmits changes in ICP through a saline-filled tube to a diaphragm on a strain gauge transducer. This monitor must be leveled with the foramen of Monro (approximately the level of the external auditory canal) after insertion and should be zero-balanced daily. The level of the drain can be adjusted to allow more or less CSF drainage.
➿Subdural bolt / Catheters
✔️ less invasive
✔️ Bolts commonly use fiberoptic technology that allows continuous ICP monitoring without CSF drainage. The fiberoptic type of catheter can be placed in the subdural space or in the brain parenchyma
✔️ Usually subdural space over frontal lobe of non-dominant hemisphere is selected
✔️ Prone to signal damping and calibration drift
✔️ Potential risk of infection
✔️ Doesn’t require penetration of brain tissue
✔️Camino Post Craniotomy Subdural Pressure Monitor utilizes the craniotomy bur holes and flap as a point of entry. The monitor is zero-balanced and then tunneled under the scalp toward the craniotomy bur hole of choice and positioned in the subdural space. This monitor contains a microtransducer at the tip, which is similar to the OLM ICP monitor ( see below)
✔️Gaeltec ICT/B pressure sensor is intended to monitor ICP subdurally. It contains a balloon-covered pressure sensor that is activated when filled with air. This monitor is self–zero-balanced in vivo and is reusable.
➿Intracerebral transducer
✔️Parenchymal devices are easier to place, particularly when altered ventricular anatomy may limit ventricular catheter placement.
✔️However, intraparenchymal fiber-optic and electronic strain gauge systems are more expensive and cannot be recalibrated once in situ
✔️Inability to check zero calibration & drain CSF
✔️ Risk of infection
✔️Less reliable
✔️The Camino OLM ICP monitor measures ICP in the intraparenchymal tissue or subarachnoid space. It contains a transducer at the distal tip, thus measuring pressure without a fluid-filled system. The catheter is secured to the skull through an adjustable bolt, allowing placement at variable depths (up to 5 cm).
✔️The Codman Microsensor catheter can be used as an intraparenchymal or intraventricular monitor, depending on the depth of the catheter
✔️ Spiegelberg ICP monitors measure ICP through an air-pouch system attached to a pressure transducer connected to an electronic device. The probes differ, depending on where they rest (Epidural or Intraparenchymal)
🔸The incidence of infection ~ 2-7% with monitoring ≥ 5 days
🔸The risks are slightly greater with dural penetration
🔸The zero reference point of the transducer is usually taken as the external auditory meatus
🔸 Rather than the waveform type, the important factors appear to be the degree and duration of ICP elevation
🔸Two emerging non-invasive ICP monitoring methods include measuring the optic nerve sheath diameter (ONSD) as seen on an ultrasound probe placed on the superolateral aspect of the orbit and the pulsatility index (PI) which is cal- culated from transcranial Doppler studies (TCD).
#NeuroAnesthesia , #anaesthesia , #TheLayMedicalMan , #NeuroCriticalCare , #CriticalCare , #NeuroICU