The Kappa Test and the Medical Researcher

  • Measurement of the extent to which data collectors (raters) assign the same score to the same variable is called interrater reliability (extent of agreement among data collectors)
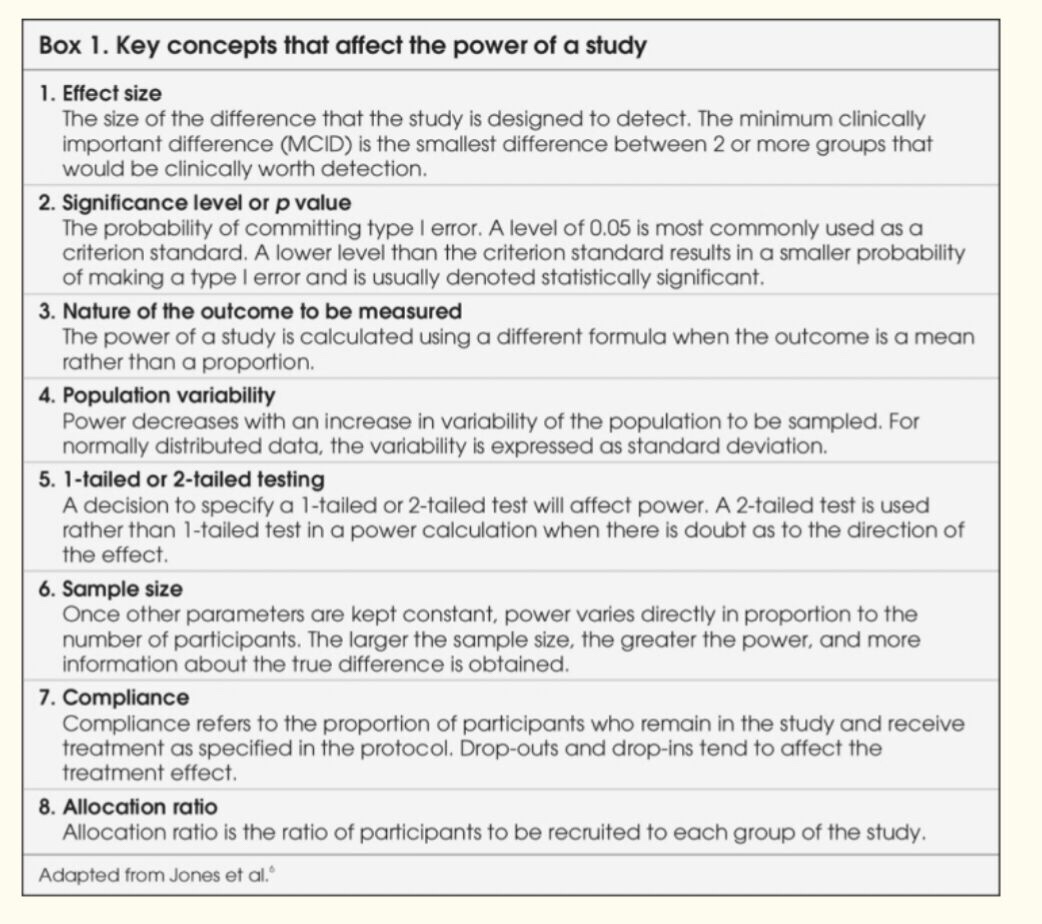
  • Interrater reliability is a concern to one degree or another in most large studies due to the fact that multiple people collecting data may experience and interpret the phenomena of interest differently
  • While there have been a variety of methods to measure interrater reliability, traditionally it was measured as percent agreement, calculated as the number of agreement scores divided by the total number of scores; but it will not account for chance agreement. i.e. it does not take account of the possibility that raters guessed on scores. Cohen’s kappa was developed to account for this concern
  • Cohen’s kappa, symbolized by the lower case Greek letter, κ is a robust statistic useful for either interrater or intrarater reliability testing.
  • Similar to correlation coefficients, it can range from −1 to +1, where 0 represents the amount of agreement that can be expected from random chance, and 1 represents perfect agreement between the raters. While kappa values below 0 are possible, they are unlikely in practice
  • Cohen suggested the Kappa result be interpreted as follows: values ≤ 0 as indicating no agreement and 0.01–0.20 as none to slight, 0.21–0.40 as fair, 0.41– 0.60 as moderate, 0.61–0.80 as substantial, and 0.81–1.00 as almost perfect agreement. But there are many arguments against this classification and a modified classification has been recommended
  • Any kappa below 0.60 indicates inadequate agreement among the raters and little confidence should be placed in the study
  • Kappa may lower the estimate of agreement excessively. Also it cannot be directly interpreted, and thus it has become common for researchers to accept low kappa values in their interrater reliability studies.
  • Low levels of interrater reliability are not acceptable in health care or in clinical research, especially when results of studies may change clinical practice in a way that leads to poorer patient outcomes. The best advice for researchers is to calculate both percent agreement and kappa. If there is likely to be much guessing among the raters, it may make sense to use the kappa statistic, but if raters are well trained and little guessing is likely to exist, the researcher may safely rely on percent agreement to determine interrater reliability.

POWER OF A STUDY

🔸The power of a study is defined as “the ability of a study to detect an effect or association if one really exists in a wider population.”

🔸In clinical research, we conduct studies on a subset of the patient population because it is not possible to measure a characteristic in the entire population. Therefore, whenever a statistical inference is made from a sample, it is subject to some error.

🔸Investigators try to reduce systematic errors with an appropriate design so that only random errors remain. Possible random errors to be considered before making inferences about the population under study are type I and type II errors.

🔸To make a statistical inference, 2 hypotheses must be set: the null hypothesis (there is no difference) and alternate hypothesis (there is a difference).

🔸The probability of reaching a statistically significant result if in truth there is no difference or of rejecting the null hypothesis when it should have been accepted is denoted by type I error. It is similar to the false positive result of a clinical test.

🔸Type I errors are caused by uncontrolled confounding influences, and random variation. The probability of a type I error occurring can be pre-defined and is denoted as α or the significance level (represented by the p-value). The corresponding 1−α, or 95%, represents the specificity of the test.

🔸The p value may vary from 1 (the groups are the same) to 0 (100% certainty that the groups are different).

🔸In most clinical research, a conventional arbitrary value of P<0.05 is commonly used. This is an arbitrary figure which means that there is a 1 in 20 (5%) chance that there really is no difference between groups. Said in another way, if the null hypothesis is rejected, there should be a 5% chance of a type I error.

🔸As the p value becomes lower the possibility of there being ‘no difference when one has been found’ becomes more and more remote (e.g. p = 0.01, 1 in 100 and p = 0.001, 1 in 1000). Thus the lower the p value the less likely that a type 1 error has been made.

🔸As the sample size of a study increases, the P-value will decrease.

🔸The probability of not detecting a minimum clinically important difference if in truth there is a difference or of accepting the null hypothesis when it should have been rejected is denoted as β, or the probability of type II error. It is similar to the false negative result of a clinical test.

🔸The typical value of β is set at 0.2. The power of the study, its complement, is 1-β and is commonly reported as a percentage. Studies are often designed so that the chance of detecting a difference is 80% with a 20% (β = 0.2) chance of missing the Minimum Clinically Important Difference (MCID)

🔸This power value is arbitrary, and higher power is preferable to limit the chance of applying false negative (type II error) results.

🔸Type II errors are more likely to occur when sample sizes are too small, the true difference or effect is small and variability is large.

🔸The belief is that the consequences of a false positive (type I error) claim are more serious than those of a false negative (type II error) claim, so investigators make more stringent efforts to prevent this type of error

🔸At the stage of planning a research study, investigators calculate the minimum required sample size by fixing the chances of a type I or II error, strength of association and population variability. This is called “power analysis,” and the purpose is to establish what sample size is needed to assure a given level of power (minimum 80%) to detect a specified effect size.

🔸From this, one can see that for a study to have greater power (smaller β or fewer type II errors), a larger sample size is needed.

🔸Sample size, in turn, is dependent on the magnitude of effect, or effect size. If the effect size is small, larger numbers of participants are required for the differences to be detected.

🔸Determining the sample size, therefore, requires the MCID in effect size to be agreed upon by the investigators.

🔸It is important to remember that the point of powering a study is not to find a statistically significant difference between groups, but rather to find clinically important or relevant differences.

🔻N.B. The odds ratio is the ratio of the odds of the event happening in an exposed group versus a non-exposed group. The odds ratio is commonly used to report the strength of association between exposure and an event. The larger the odds ratio, the more likely the event is to be found with exposure. The smaller the odds ratio is than 1, the less likely the event is to be found with exposure.