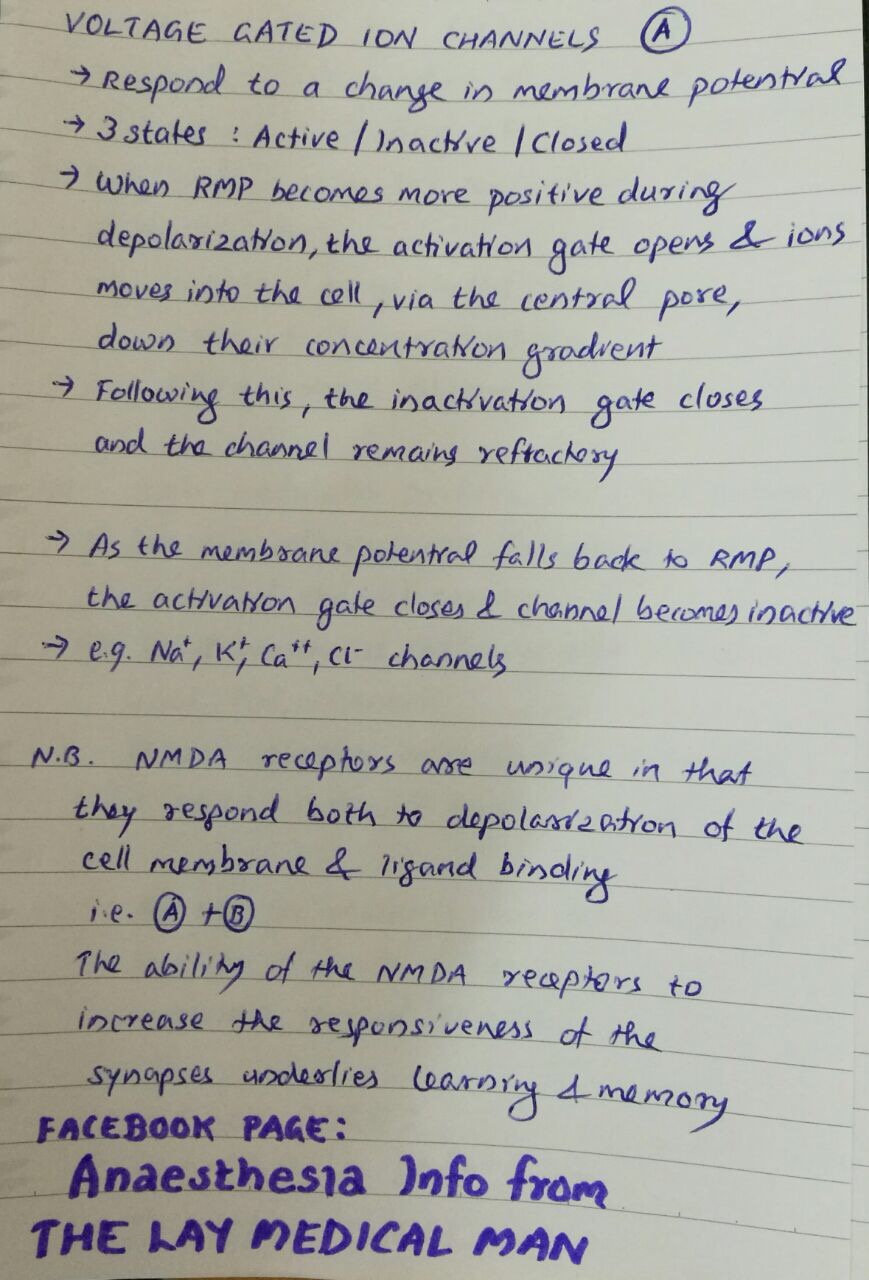


VOLTAGE & LIGAND GATED ION CHANNELS
Mannitol is a monosaccharide available as 10% & 20% solutions
DURING NEUROSURGERY/ IN NEUROCRITICAL CARE:
✔️Mannitol is freely filtered in the glomerulus but won’t get reabsorbed in the tubules; so it will drive water from the interstitium which gets eliminated as urine. Hence acts as an osmotic diuretic
✔️When blood brain barrier is intact, the osmotic gradient created by mannitol will move water from the cerebral extravascular compartment to the intravascular space, reducing ICP. If blood brain barrier is not intact, it will worsen cerebral edema.
✔️The expansion of the plasma volume caused by mannitol will reduce the viscosity and improve cerebrovascular microcirculation and oxygenation. The increase in cardiac output can also cause an increase in regional blood flow which will cause a compensatory cerebrovascular vasoconstriction in areas where autoregulation is intact.
IN CRUSH INJURY / MYOGLOBINURIA
✔️Will release renal prostaglandins, which will cause renal vasodilation and increase tubular urine flow causing a solute washout and avoidance of tubular obstruction #TheLayMedicalMan
MECHANISM BEHIND ADVERSE EFFECTS
✔️The initial increase in plasma volume as a result of drawing of water into the vascular component and the resultant increase in cardiac output can precipitate heart failure in cardiac patients
✔️The osmotic diuresis can cause hypernatremia [increases urinary losses of both sodium and electrolyte-free water] , metabolic acidosis and hyperosmolarity. It has been advised that therapy should be monitored and titrated so that osmolarity doesn’t go up beyond 300 mOsm/L
✔️The rise in the plasma potassium concentration following hypertonic mannitol is due to the movement of potassium out of the cells into the extracellular fluid as the rise in cell potassium concentration induced by water loss favors passive potassium exit through potassium channels in the cell membrane
✔️Though it has been used for renal protection, the reduction in renal perfusion resulting from hypovolemia caused by diuresis can adversely affect renal function; so should be avoided in patients with renal dysfunction
#Neuroanesthesia , #Anesthesia , #Neurology , #CriticalCare
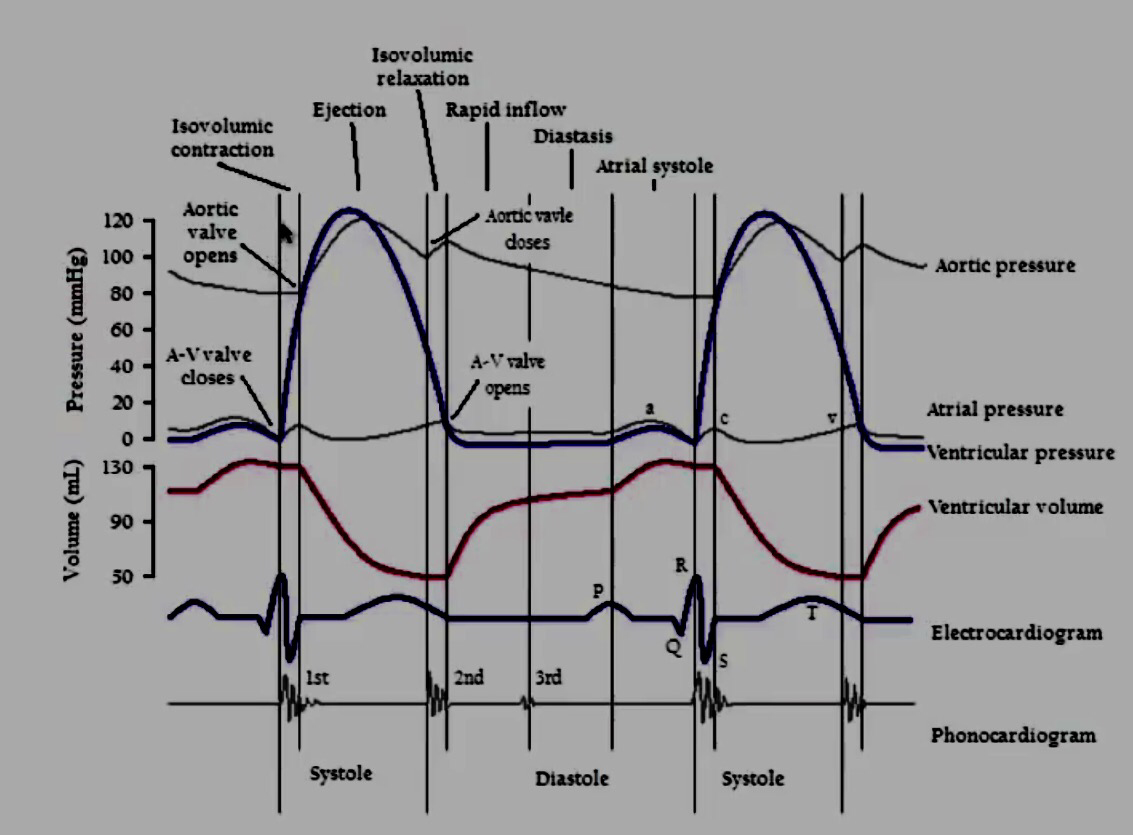
1. ATRIAL CONTRACTION (Phase 1): It is initiated by the P wave of the ECG which represents electrical depolarization of the atria. Atrial contraction does produce a small increase in venous pressure that can be noted as the “a-wave“. Just following the peak of the a-wave is the x-descent. Atrial contraction normally accounts ONLY for about 10% of left ventricular filling when a person is at rest. At high heart rates when there is less time for passive ventricular filling, the atrial contraction may account for up to 40% of ventricular filling. This is sometimes referred to as the “atrial kick.” The atrial contribution to ventricular filling varies inversely with duration of ventricular diastole and directly with atrial contractility. The volume of blood at the end of the filling phase is the end diastolic volume and is around 120 mL in the adult. S4 sound is caused by vibration of the ventricular wall during atrial contraction. Generally, it is noted when the ventricle compliance is reduced (“stiff” ventricle) as occurs in ventricular hypertrophy and in many older individuals.
2. Isovolumetric Contraction (Phase 2): This phase of the cardiac cycle begins with the appearance of the QRS complex of the ECG, which represents ventricular depolarization. The AV valves close when intraventricular pressure exceeds atrial pressure. Closure of the AV valves results in the first heart sound (S1). During the time period between the closure of the AV valves and the opening of the aortic and pulmonic valves, ventricular pressure rises rapidly without a change in ventricular volume (i.e., no ejection occurs). Ventricular volume does not change because all valves are closed during this phase. Contraction, therefore, is said to be isovolumetric. The “c-wave” noted in the venous pressure may be due to bulging of A-V valve leaflets back into the atria. Just after the peak of the c wave is the y’-descent.
3. Rapid Ejection (Phase 3): Ejection begins when the intraventricular pressures exceed the pressures within the aorta (~80 mm of Hg) and pulmonary artery, which causes the aortic and pulmonic valves to open. Left atrial pressure initially decreases as the atrial base is pulled downward, expanding the atrial chamber. Blood continues to flow into the atria from their respective venous inflow tracts and the atrial pressures begin to rise. This rise in pressure continues until the AV valves open at the end of phase 5.
4. Reduced Ejection (Phase 4): Approximately 200 msec after the QRS and the beginning of ventricular contraction, ventricular repolarization occurs as shown by the T-wave of the electrocardiogram. Repolarization leads to a decline in ventricular active tension and pressure generation; therefore, the rate of ejection (ventricular emptying) falls. Ventricular pressure falls slightly below outflow tract pressure; however, outward flow still occurs due to kinetic (or inertial) energy of the blood. Left atrial and right atrial pressures gradually rise due to continued venous return from the lungs and from the systemic circulation, respectively.
5. Isovolumetric Relaxation (Phase 5): When the intraventricular pressures fall sufficiently at the end of phase 4, the aortic and pulmonic valves abruptly close (aortic precedes pulmonic) causing the second heart sound (S2) and the beginning of isovolumetric relaxation. Valve closure is associated with a small backflow of blood into the ventricles and a characteristic notch (incisura or dicrotic notch) in the aortic and pulmonary artery pressure tracings. Although ventricular pressures decrease during this phase, volumes do not change because all valves are closed. The volume of blood that remains in a ventricle is called the end-systolic volume and is ~50 ml in the left ventricle. The difference between the end-diastolic volume and the end-systolic volume is ~70 ml and represents the stroke volume. Left atrial pressure (LAP) continues to rise because of venous return from the lungs. During isovolumetric ventricular relaxation, atrial pressure rises to 5 mmHg in the left atrium and 2 mmHg in the right atrium.
6. Rapid Filling (Phase 6): As the ventricles continue to relax at the end of phase 5, the intraventricular pressures will at some point fall below their respective atrial pressures. When this occurs, the AV valves rapidly open and passive ventricular filling begins. The opening of the mitral valve causes a rapid fall in LAP. The peak of the LAP just before the valve opens is represented by the “v-wave.” This is followed by the y-descent of the LAP. A similar wave and descent are found in the right atrium and in the jugular vein. When a third heart sound (S3) is audible during rapid ventricular filling, it is often pathological and is caused by ventricular dilatation.
7. Reduced Filling (Phase 7): As the ventricles continue to fill with blood and expand, they become less compliant and the intraventricular pressures rise. The increase in intraventricular pressure reduces the pressure gradient across the AV valves so that the rate of filling falls late in diastole. In normal, resting hearts, the ventricle is about 90% filled by the end of this phase. In other words, about 90% of ventricular filling occurs before atrial contraction (phase 1) and therefore is passive.
8. Right Vs Left: The major difference between the right and left side of the cardiac chambers, is that the peak systolic pressures of the right heart are substantially lower than those of the left heart, and this is because pulmonary vascular resistance is lower than systemic vascular resistance. Typical pulmonary systolic and diastolic pressures are 24 and 8 mm Hg, respectively.
9. Jugular Venous Pressure Summary: Right atrial pressure pulsations are transmitted to jugular veins. Thus, atrial contractions produce the first pressure peak called the a wave. Shortly thereafter, the second peak pressure called the c wave follows and this is caused by the bulging of the tricuspid valve into the right atrium. After the c wave, the right atrial pressure decreases (‘x’ descent) because the atrium relaxes and the tricuspid valve descends during ventricular emptying. As the central veins and the right atrium fill behind a closed tricuspid valve, the right atrial pressure rises towards a third peak, the v wave. When the tricuspid valve opens at the end of ventricular systole, right atrial pressure decreases again as blood enters the relaxed right ventricle (‘y’ descent). The right atrial pressure begins to rise shortly as blood returns to the right atrium and the right ventricle together during diastole.
 Ref: Principles of Physiology for the Anaesthetist, Peter Kam, Ian Power, http://www.cvphysiology. com
#CardiacCycle , #Physiology , #Anesthesia

# NPPO is associated with upper airway obstruction in a spontaneously breathing patient.
# It occurs in 0.05–0.1% of all general anaesthetic cases and laryngospasm has been reported as being the cause in 50% of cases.
#The clinical course is most frequently observed on emergence from anaesthesia where incomplete recovery from general anaesthesia increases the likelihood of the development of laryngospasm, but it has also been reported after airway obstruction with a foreign body and blockage and biting of tracheal tubes, hanging, and strangulation.
#Pulmonary oedema is typically described as developing within 2 min of the obstruction.
Once the airway is occluded, the spontaneously breathing patient will continue to generate negative intrathoracic pressure which will increase substantially as respiratory distress develops.
#There is an associated increase in sympathetic tone due to the stress of hypoxia and airway obstruction which increases SVR and elevates pulmonary artery pressure.
This is further exacerbated by hypoxic pulmonary vasoconstriction.
#The combination of these processes creates a pressure gradient across the capillary–alveolar membrane which favours the movement of fluid into the lung parenchyma.
#It is most common in younger patients, presumably because they are able to generate higher negative inspiratory pressures and, arguably, have a higher sympathetic tone and better cardiac function.
#The condition may resolve rapidly after definitive management of the airway obstruction, but in some cases, copious pulmonary oedema may form and it can be associated with pulmonary haemorrhage suggesting capillary membrane damage.
#After recognition of the cause of obstruction, the treatment required ranges from relatively modest support such as brief periods of CPAP for 2 h to positive pressure ventilation over a period of 24 h.#TheLayMedicalMan
Ref: Neurogenic pulmonary edema, Ronan O’Leary, Justin McKinlay, Contin Educ Anaesth Crit Care Pain (2011) 11 (3): 87-92.
http://feeds.feedburner.com/TheLayMedicalMan

🔸In the pregnant patient, the respiratory function deviates from the normal
🔸There is increased CO2 production by the mother and the foetus; but mostly you see a respiratory alkalosis. Why?
🔸This is because the stimuli from the raised pCO2 levels and that by the respiratory stimulant, progesterone, sets the minute ventilation approximately 30% higher than the normal levels and this is more than what is needed to compensate for the increased CO2 production
🔸It is mainly the reduction in FRC (a reduction by 10-25% ; appears by 12th week ; is due to the reduced chest wall compliance ; lung compliance is normal ) which makes the patient more vulnerable to hypoxia.
🔸The alveolar diffusing capacity is reported to be normal during pregnancy
