Category Archives: Exams EDAIC FRCA
Damping
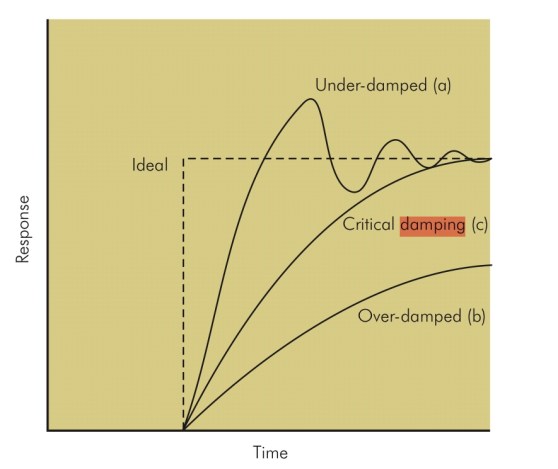
- Damping describes the resistance of a system to oscillation resulting from a change in the input. Damping is the result of frictional forces working in that system. So following a change in input there are several possible outcomes for the system:
- Perfect Response: any change in input would be instantly and accurately reflected in the output
- Under-damped – the output changes quickly in response to the step up in input, but it overshoots and then oscillates around the true value, before coming to rest at it. It will take some time before the true value is displayed and the peaks and troughs will over and underrepresent the true value. In a dynamic system, e.g. intra-arterial BP, the constantly changing input may result in wild fluctuations, rendering an under-damped system very inaccurate (although the MAP is still correct).
- Critically damped – the response and rise time of the system are longer than an under-damped response, but there is no significant overshoot and oscillations are minimal. ‘D’ is the damping factor and, by convention, in a critically damped system D = 1.
- Over-damped – defined as damping greater than critical. The output here could potentially change so slowly that it never reaches the true value. In a dynamic system, the response time may be too slow for the system to be useful.
- Optimally damped – in reality in clinical measurement systems, critical damping is not ideal and we are prepared to accept a few oscillations and some overshoot to achieve a faster response time. Hence, our systems are ‘optimally damped’ where 64% of the energy is removed from the system and D = 0.64. There is a 7% overshoot in this case.
- N.B: The ‘response time’ is the time taken for the output to reach 90% of its final reading. The ‘rise time’ is the time taken for the output to rise from 10 to 90% of its final reading.
- All instruments will possess damping that affects their dynamic response. This includes mechanical, hydraulic, pneumatic and electrical devices. In an electromechanical device such as a galvanometer there are mechanical moving parts such as the meter needle and bearings. Damping in these components arises from frictional effects on their movement. This may arise unintentionally or may be applied as part of the instrument design to control oscillation of the needle when it records a measurement. In a fluid (gas or liquid) operated device, damping occurs due to viscous forces that oppose the motion of the fluid. In an electrical system, damping is provided electronically by electrical resistance that opposes the passage of electrical currents.
- Damping is an important factor in the design of any system. In a measurement system it can lead to inaccuracy of the readings or display:
- Under-damping can result in oscillation and overestimation of the measurement.
- Over-damping can result in underestimation of the measurement.
- Critical damping is usually an optimum compromise resulting in the fastest steady-state reading for a particular system, with no overshoot or oscillation.
Drowning: Specific points
- Drowning is death while submerged in water, and near-drowning is suffocation while submerged with survival (at least temporary).
- If water does not enter the airway, asphyxia is the main complication.
- If the patient inhales water, marked intrapulmonary shunting & significant V/Q mismatching because of loss of pulmonary surfactant (wash-out) and reflex laryngobronchospasm are also mechanisms
- Significant volumes of hypotonic fresh water aspiration can lead to hyponatremia and hemodilution.
- Cold water drowning leads to loss of consciousness at a temperature below 32°C and ventricular fibrillation can occur at 28° to 30°C. Resuscitation efforts may be very prolonged after cold water aspiration
- Aspiration of gastric contents because of unconsciousness and lack of airway reflexes can further complicate lung injury and risk of death.
- All patients will have hypoxemia, hypercarbia and metabolic acidosis from lack of oxygen delivery and subsequent lactic acid production.
- Also Cerebral edema, ALI, and ARDS can complicate medical courses
- Treatment: restore spontaneous circulation and ventilation, focus on improving oxygen delivery further to decrease metabolic acidosis. Because of a significant risk of ALI and ARDS, airway management and lung protection ventilation strategies should be initiated as soon as possible. Cerebral protection maneuvers should also be followed and neurosurgical consultation obtained when appropriate. Electrolyte and temperature derangements should be treated. Patients’ clinical courses will be labile.
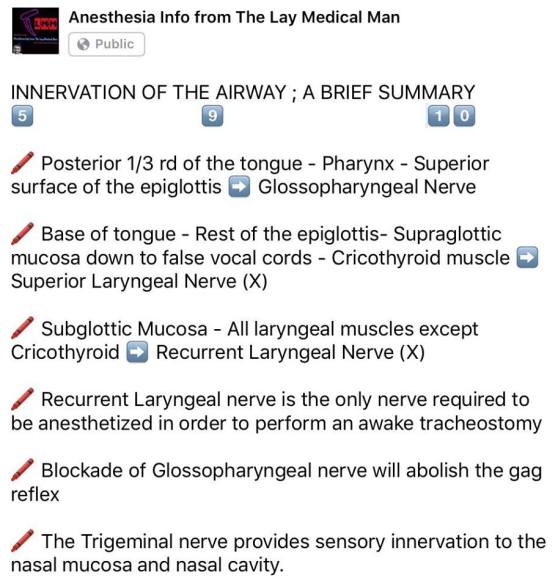
VIVA SCENE: NERVE SUPPLY OF AIRWAY / LARYNX
Morphine and Hydromorphone
- Morphine is metabolised via hepatic system and excreted by renal system
- It can get accumulated in hepatic/renal dysfunction and obesity
- Morphine has 2 metabolites:
- Morphine 6 glucoronide- Active metabolite: responsible for analgesia and sedation
- Morphine 3 glucoronide: Can cause seizures
- Morphine has histamine releasing property
- Hydromorphone is more potent than morphine
- Hydromorphone doesnt have active metabolites
- Hydromorphone lacks histamine release
CLOSING CAPACITY
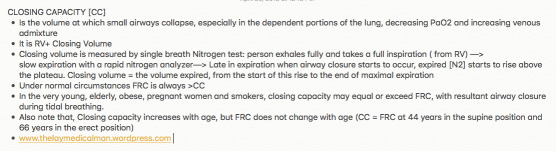
FUNCTIONAL RESIDUAL CAPACITY [FRC]
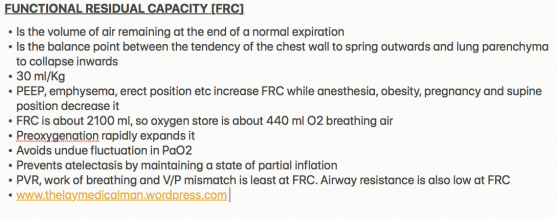
The functional residual capacity of the infant’s lungs is only one half that of an adult in relation to body weight. This difference causes excessive cyclical increases and decreases in the newborn baby’s blood gas concentrations if the respiratory rate becomes slowed because it is the residual air in the lungs that smooths out the blood gas variations.
The functional residual capacity equals the expiratory reserve volume plus the residual volume. This is the amount of air that remains in the lungs at the end of normal expiration (about 2300 milliliters).
INTRA-PLEURAL PRESSURE
- The resting position of the lungs and chest wall occurs at FRC.
- If isolated, the lungs, being elastic, would collapse to a volume <FRC.
- The isolated thoracic cage would normally have a volume >FRC.
- Since the chest wall is coupled to the lung surface by the thin layer of intrapleural fluid between parietal and visceral pleura, opposing lung and chest wall recoil forces are in equilibrium at FRC.
- This produces a pressure of about −0.3 kPa [−2 mmHg ] in the pleural space.
- Normal inspiration reduces intrapleural pressure further to −1.0 kPa [−6 mmHg] but with forced inspiration it can reach negative pressures of −4.0 kPa or more.
- Intrapleural pressure may be measured by an intrapleural catheter or from a balloon catheter placed in the mid-oesophagus [Oesophageal pressures
tend to reflect intrapleural pressures] - In the upright adult the intrapleural pressure at the base of the lung is approximately 0.7 kPa greater than the pressure at the apex
- It will increase during coughing
- -1.0 kPa intrapleural pressure is equivalent to a distending transpulmonary pressure of +1.0 kPa
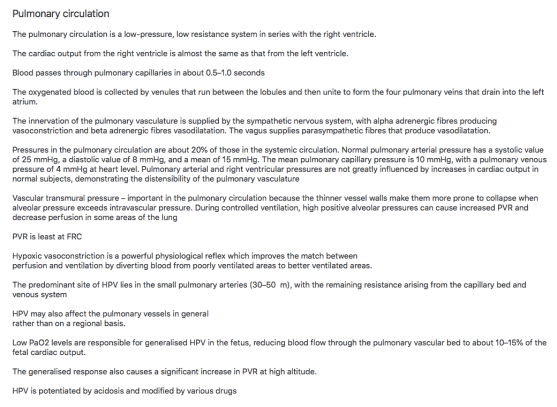
PULMONARY CIRCULATION
Protamine